![]()
Event log monitoring with PRTG
Monitor and analyze critical log events and fix issues quickly
- Monitor Windows event logs, syslogs, and other critical network activities 24/7
- Centralize event log management and stay compliant
- Proactively detect and address system errors, malfunctions, and security issues
Our users give top ratings for monitoring with Paessler PRTG


PRTG event log monitoring: What you’ll find on this page

- Do you know what’s going on in your network?
- 4 reasons why to choose PRTG as your event log monitoring tool
- What event log monitoring looks like in PRTG
- Complete control over event logs… and your network's health
- Explore our preconfigured PRTG sensors for event log monitoring
- Monitoring event logs: FAQ
Do you know what’s going on in your network?
If you want to identify system, application, or service errors, problems with authentication or permissions, potential security threats, and other issues that could impact your network’s health and performance, Windows event logs and syslogs can offer you a wealth of information.
But when your network has dozens of components and applications, the sheer volume of Windows event logs and syslogs you’ll need to trawl through to identify and troubleshoot issues is... well, let’s say it makes War and Peace seem like a short story.
Paessler PRTG’s comprehensive security event log and network performance monitoring tool keeps a close eye on every single metric or variable that could have an impact on your system, so you don’t have to. You’ll get alerted the second something doesn’t look quite right.
And, because you’ll have a golden source of truth, you’ll have a much easier time conducting effective security audits and proving compliance.
PRTG makes event log monitoring as easy as it gets
Custom alerts and data visualization let you quickly identify and prevent issues shown in your event log files.
4 reasons why to choose PRTG as your event log monitoring tool
Plug-and-play setup
No thick manuals to read or complex configurations. The automatic network discovery scans your chosen IP address range, connects every network component in that range, and assigns the appropriate sensors. You don't need to do anything, unless you want to customize your environment and parameters.
All-in-one monitoring
Why switch between multiple Windows Event Viewers, systems, and monitoring dashboards? PRTG brings together the data of all your Windows event logs and syslogs in one place, together with other network data, including cloud services, SQL databases, Active Directory integrations, and Windows servers.
Proactive protection
Spot, troubleshoot, and fix issues fast, instead of trying to figure things out after the fact. PRTG's preconfigured sensors track threshold-based key metrics round the clock and alert you as soon as there are potential issues, so you can nip them in the bud before your colleagues or your customers even notice.
Effortless compliance
Does your organization operate in financial services, healthcare, or other regulated industries? With a comprehensive event log analyzer and powerful automations in place, you can show tangible proof you take your data obligations and regulatory requirements seriously.
What event log monitoring looks like in PRTG
Diagnose network issues by continuously tracking critical events in Windows event log files, syslogs, and other log files. Show event ID, type and level, task category, event source, and other key metrics in real time. Visualize monitoring data in clear graphs and dashboards to identify problems more easily. Gain the overview you need to troubleshoot system errors and malfunctions, unauthorized access, and other network performance and security issues.

Device tree view of the complete monitoring setup
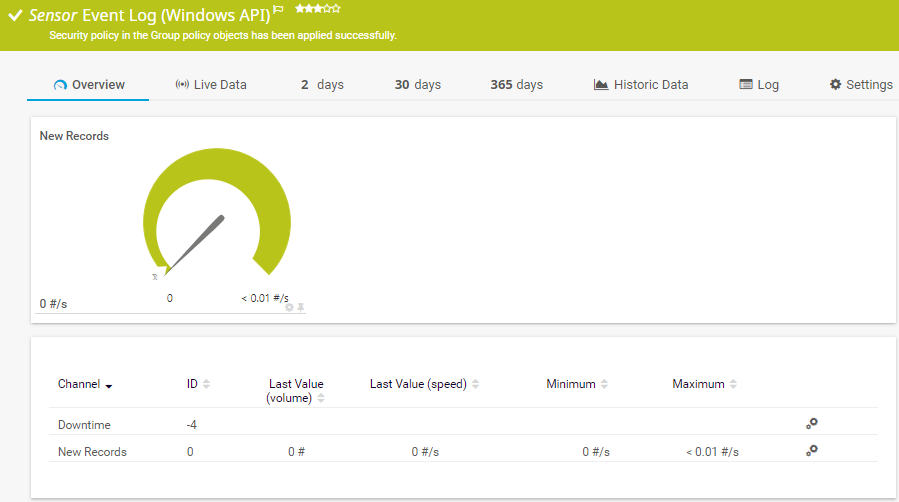
Preconfigured Event Log (Windows API) sensor in PRTG

Custom PRTG dashboard for keeping an eye on the entire IT infrastructure
Start monitoring event logs with PRTG and see how it can make your network more reliable and your job easier.
“All-around winning “The real beauty of PRTG is the endless possibilities it offers” “PRTG Network MonitorIT experts agree: Paessler PRTG is a great solution for IT infrastructure monitoring

network monitor”

is very hard to beat”
Complete control over event logs… and your network's health
Windows event log monitoring via WMI
Use Windows Management Instrumentation to monitor Windows event logs and filter event log entries by specific sources or messages to be notified in the event of an error. Monitor Windows applications, hardware events, key management service, security, system, and PowerShell.
Event log monitoring via Windows API
Or use the Windows API to monitor the event log files of Windows applications, system, security, directory service, DNS server, and file replication service.
Syslog message monitoring
Collect and analyze incoming syslog messages on a specific port using UDP. Use it to monitor all your system messages or only those from a specific device. Set filter options to fine-tune your monitoring and determine whether the messages are warning or error messages.
Your event log monitor at a glance – even on the go
Set up PRTG in minutes and use it on almost any mobile device.


Explore our preconfigured PRTG sensors for event log monitoring
PRTG comes with more than 250 native sensor types for monitoring your entire on-premises, cloud, and hybrid cloud environment out of the box. Check out some examples below!
WMI Event Log
The WMI Event Log sensor monitors a Windows log file. It can show the following:
- Downtime
- Number of new records
Event Log (Windows API)
The Event Log (Windows API) sensor monitors event log entries via the Windows API. It can show the following:
- Downtime
- Number of new records
Syslog Receiver
The Syslog Receiver sensor receives and analyzes Syslog messages. It can show the following:
- Number of dropped packets on the syslog port
- Number of messages categorized as "error" and “warning”
- Number of received Syslog messages
File Content
The File Content sensor checks a text file (for example, a log file) for certain strings. It can show the following:
- Number of matches
- Line number of the last match
Find the root cause of the problem with our PRTG event log monitoring solution
Real-time notifications mean faster troubleshooting so that you can act before more serious issues occur.
PRTG is compatible with all major vendors, products, and systems
![]()
Create innovative solutions with Paessler’s partners
Partnering with innovative vendors, Paessler unleashes synergies to create
new and additional benefits for joined customers.


With ScriptRunner, Paessler integrates a powerful event automation platform into PRTG Network Monitor.
ScriptRunner
“Excellent tool for detailed monitoring. Alarms and notifications work greatly. Equipment addition is straight forward and server initial setup is very easy. ...feel safe to purchase it if you intend to monitor a large networking landscape.”
Infrastructure and Operations Engineer in the Communications Industry, firm size 10B - 30B USD
PRTG makes event log monitoring as easy as it gets
Custom alerts and data visualization let you quickly identify and prevent issues shown in your event log files.
Monitoring event logs: FAQ
What are event logs?
Event logs record what's happening on your Windows system and other network components and endpoints: the type of event, its severity or significance, the event source, the time when it happened, and the user involved in the event. It's like CCTV for your network. Except the events are recorded textually instead of visually.
Some of the information event logs contain includes:
- Failed login attempts
- Network and software errors
- Faulty hardware
- Unresponsive systems, services, or applications
- Changes in a network connection's status
- Potential threats
Windows event logs vs. Syslogs: What's the difference?
Windows event logs and syslogs both record what's happening on your network, but they work differently and are suitable for different environments.
Event logs record what's happening on software and systems that run on Microsoft Windows, while syslogs are OS-agnostic (Linux, Unix, macOS). That is, they can record what's happening on any software, system, or device, regardless of the operating system it uses. Syslogs also have more flexible content, while Windows event logs typically follow a fairly rigid structure with predefined event IDs.
What’s the difference between event log monitoring and event log management?
Event log monitoring is the automated monitoring of event logs. With PRTG, the log files of all the computers in your network are monitored around the clock. If a critical incident occurs, the admin is notified at once.
Event log management refers to all the tasks related to the management of log files. In other words, the collection, saving, consolidating, analysis, and archiving of log data, events, and incidents.
Why use event log monitoring software?
Two reasons: clarity and simplicity.
An event log-monitoring tool brings together data from all your Windows event and application logs and syslogs on one dashboard. That saves you having to retrieve event logs and syslogs manually from individual system components’ event viewers. PRTG's preconfigured sensors also alert you automatically if there's an issue, which saves you having to review and inspect hundreds or thousands of individual event logs and gives you the peace of mind that you'll never miss a potentially serious issue.
What is a sensor in PRTG?
In PRTG, “sensors” are the basic monitoring elements. One sensor usually monitors one measured value in your network, for example the traffic of a switch port, the CPU load of a server, or the free space on a disk drive.
On average, you need about 5-10 sensors per device or one sensor per switch port.

PRTG: The multi-tool for sysadmins
Adapt PRTG individually and dynamically to your needs and rely on a strong API:- HTTP API: Access monitoring data and manipulate monitoring objects via HTTP requests
- Custom sensors: Create your own PRTG sensors for customized monitoring
- Custom notifications: Create your own notifications and send action triggers to external systems
- REST Custom sensor: Monitor almost everything that provides data in XML or JSON format
Paessler conducted trials in over 600 IT departments worldwide to tune its network monitoring software closer to the needs of sysadmins. We asked: would you recommend PRTG?
Over 95% of our customers say yes!
The result of the survey: over 95% of the participants would recommend PRTG – or already have.
Paessler PRTG is used by companies of all sizes. Sysadmins love PRTG because it makes their job a whole lot easier. Bandwidth, servers, virtual environments, websites, VoIP services – PRTG keeps an eye on your entire network. Everyone has different monitoring needs. That’s why we let you try PRTG for free.Still not convinced?
![]()
More than 500,000
sysadmins love PRTG![]()
Monitor your entire IT infrastructure
![]()
Try Paessler PRTG
for free
![]()
Start monitoring event logs with PRTG and see how it can make your network more reliable and your job easier.
|
PRTG |
Network Monitoring Software - Version 25.1.104.1946 (March 18th, 2025) |
|
Hosting |
Download for Windows and cloud-based version PRTG Hosted Monitor available |
Languages |
English, German, Spanish, French, Portuguese, Dutch, Russian, Japanese, and Simplified Chinese |
Pricing |
Up to 100 sensors for free (Price List) |
Unified Monitoring |
Network devices, bandwidth, servers, applications, virtual environments, remote systems, IoT, and more |
Supported Vendors & Applications |
|
Discover more monitoring insights and stories

Solutions for all your monitoring needs

Powerful stories from the monitoring world

Combining the broad monitoring feature set of PRTG with IP Fabric’s automated network assurance creates a new level of network visibility and reliability.